Experiment: Using Code Interpreter for Data Analysis

Code Interpreter (CI), a native ChatGPT plugin recently made available to paying subscribers, is more than a simple code execution tool. With CI, you can effortlessly create maps, charts, data visualizations, and graphical elements. In addition, Code Interpreter enables users to analyze music playlists, generate interactive HTML files, tidy up data sets, and perform even more complex operations, such as extracting color palettes from images.
As suggested by the title of this blog post, our main interest when it comes to CI lies in its capacity for data analysis. To bring this function to life and to make it easier for you to appreciate its advantages, we’ll be using a real data set with sprint statistics to gauge the impact learning has on subsequent evaluations and to find answers to other pertinent questions.
Ready to learn? Let’s dig in!
The Setup
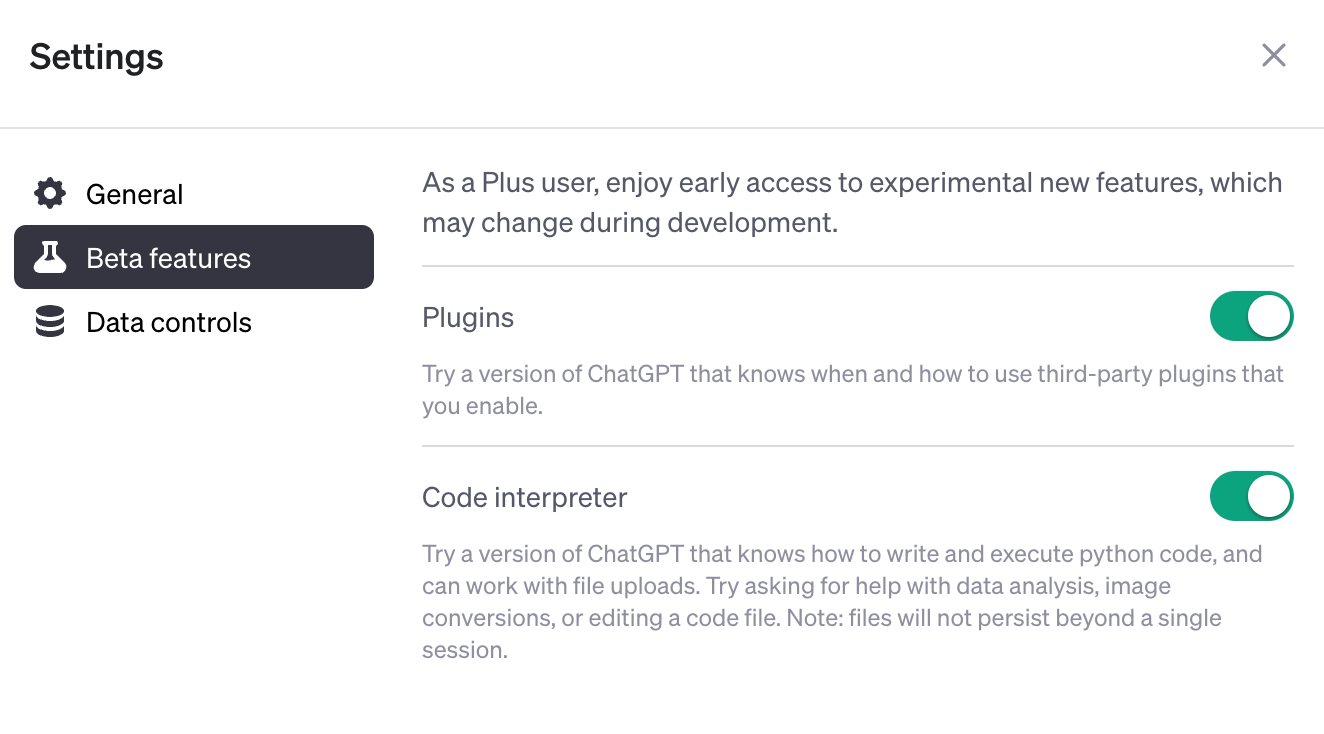
Gaining access to CI is very simple. All you have to do is log in to your ChatGPT account and go to the Settings tab. Once there, go to “Beta features” and make sure that “Code Interpreter” is switched on:
As we’ve already mentioned, CI was rolled out to subscribers of ChatGPT Plus, which is a premium service priced at around €20/month. If this seems a little steep, keep in mind that, in addition to Code Interpreter, you’ll also gain access to other exclusive third-party services like Noteable.
The Analysis
Educational process analyses are part and parcel of Turing College’s operational philosophy – to provide students with the best education possible, we’re constantly evaluating and adjusting.
Recently, our hiring partners asked us to find out the extent to which students manage to assimilate new information and improve their skills during learning sprints. We decided to do this by feeding the relevant data to ChatGPT and then using the Code Interpreter to identify patterns and insights.
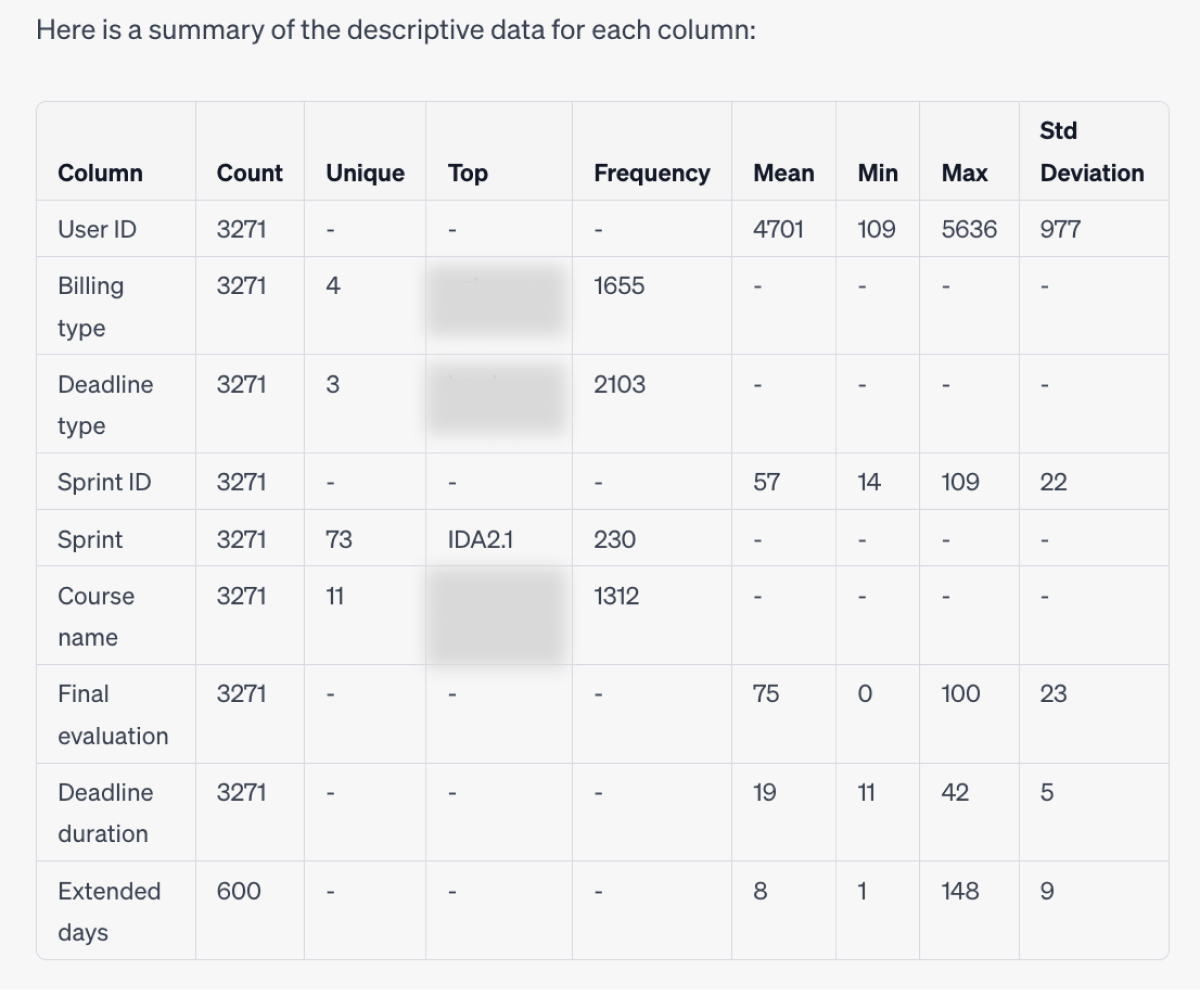
The set contained anonymized data on learning sprint durations, assessments, and other information pertinent to the analysis. We also decided to forgo setting any specific requirements, and instead went all-in. Here’s the result:
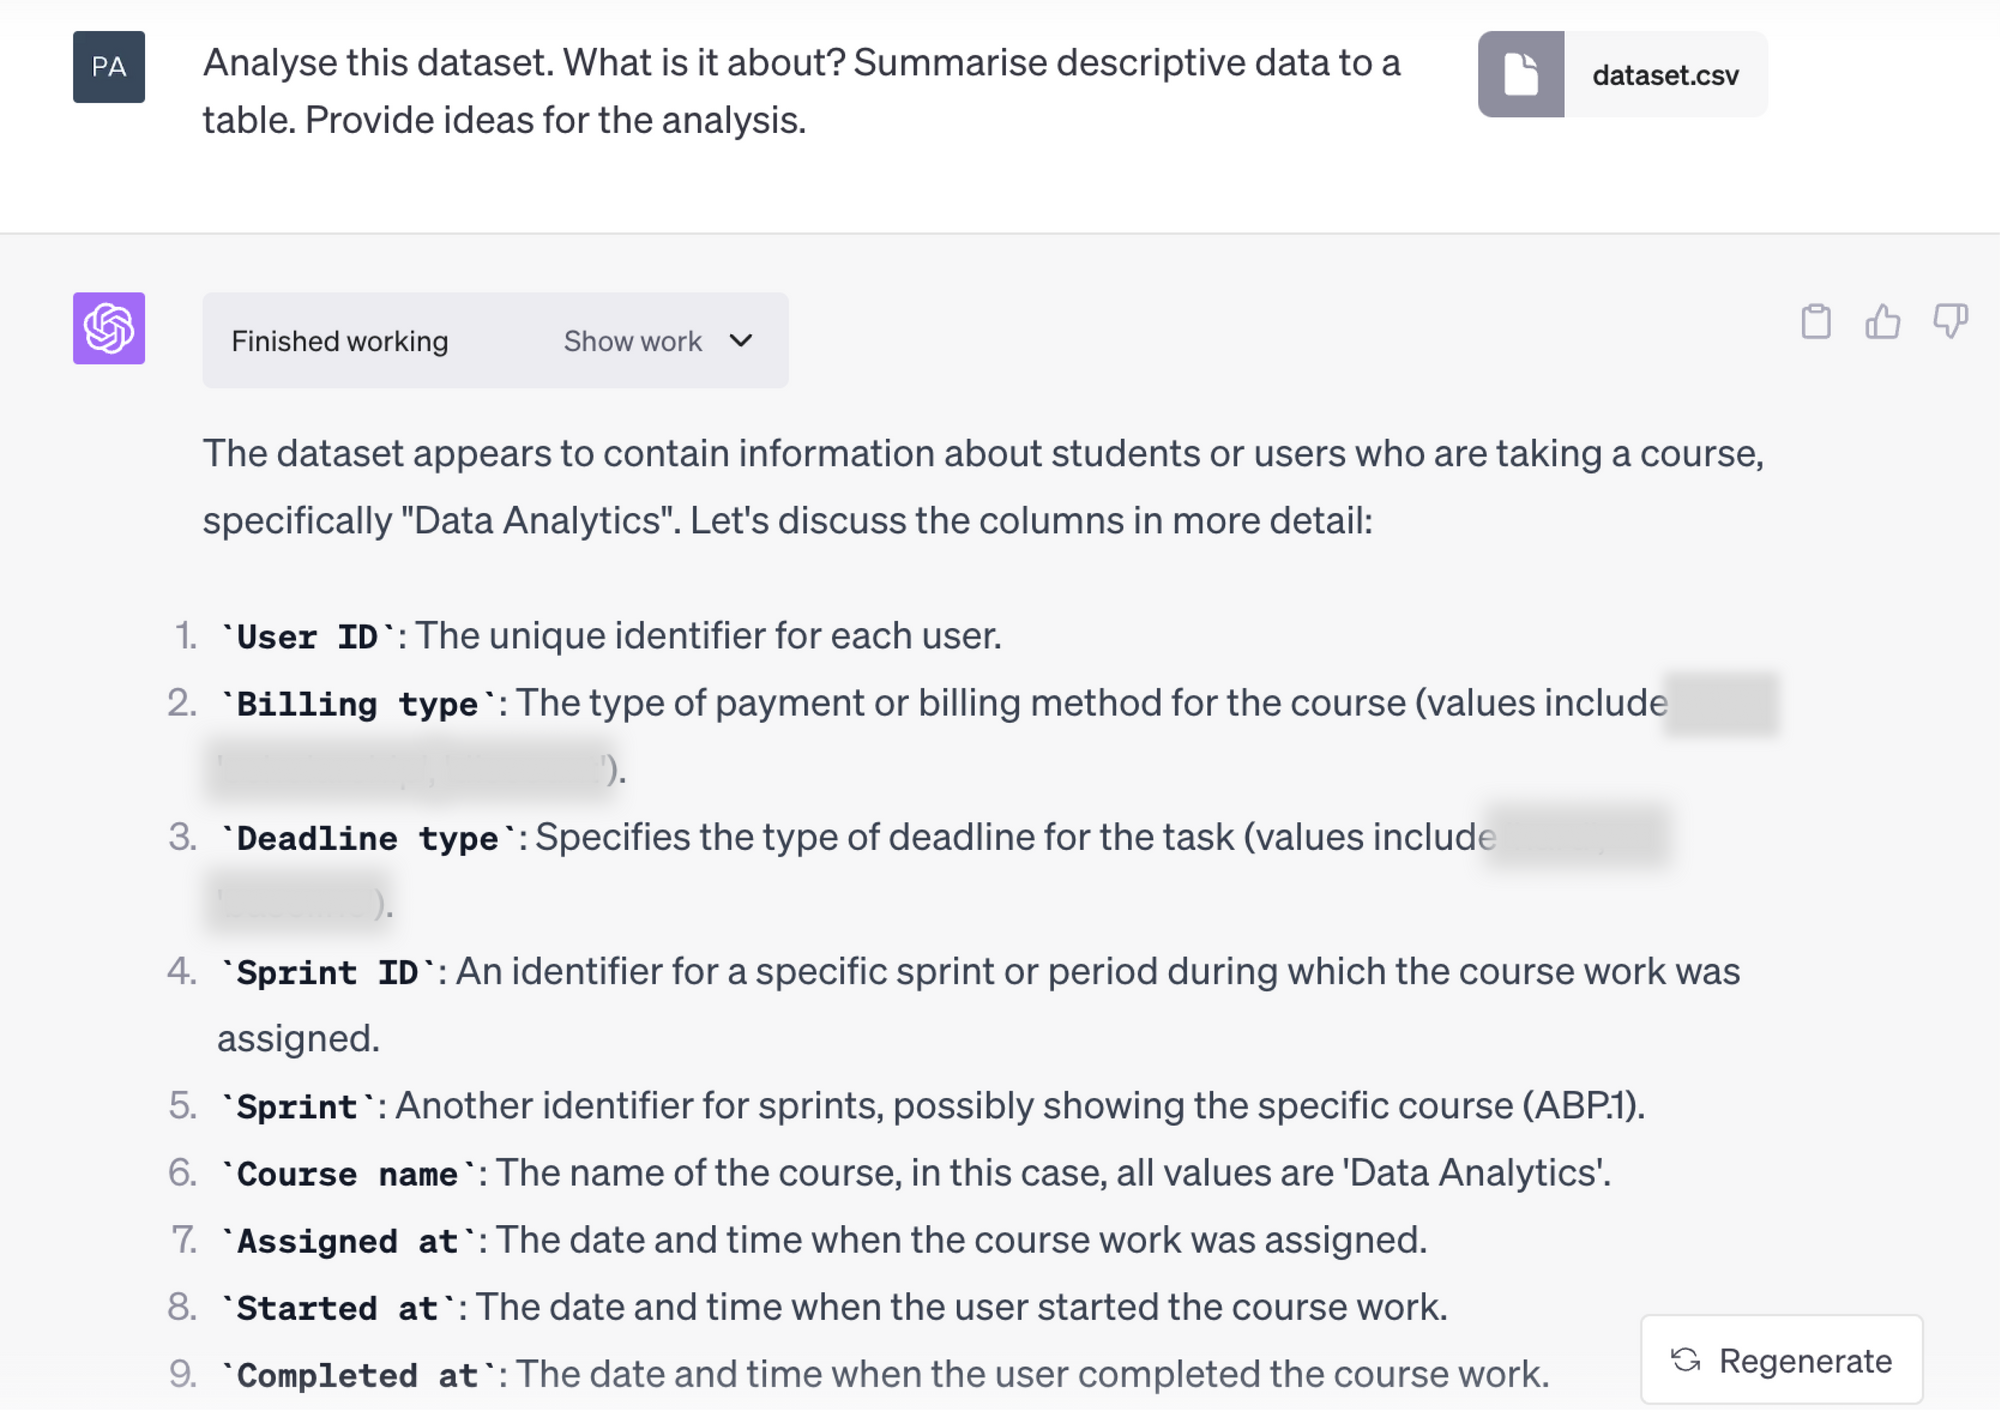
That’s a pretty deep dive! While omitting dates in the output, which is unfortunate, it did take account of all the other information and delivered everything I requested: column labels, a descriptive table, and some insights and ideas. It did, however, take some columns for descriptive analysis which does not make much sense in my case, for example, the IDs. I would rather have it better understand the dates that I had in my dataset - earliest, latest observation, etc.
The ideas for further analysis it generated were simple, yet fairly compelling. Here’s a representative sample:
- Look at the correlation between “Deadline Duration” and “Final Evaluation”. Does giving more time lead to higher scores?
- Compare “Deadline Type” with “Final Evaluation”. Does one type of deadline lead to better performance than other types?
- Analyze “Extended Days” with respect to “Final Evaluation”. Do students who get extensions perform better or worse than those who don’t?
- Compare performance (“Final Evaluation”) between individual sprints. Are there any periods where students tend to perform better or worse?
- Investigate whether users who manage to complete a given task before the deadline score higher in “Final Evaluation”.
Not bad. However, some of the suggestions (e.g., to look for a correlation between task commencement time and “Final Evaluation”) weren’t viable simply because CI failed to properly differentiate between dates.
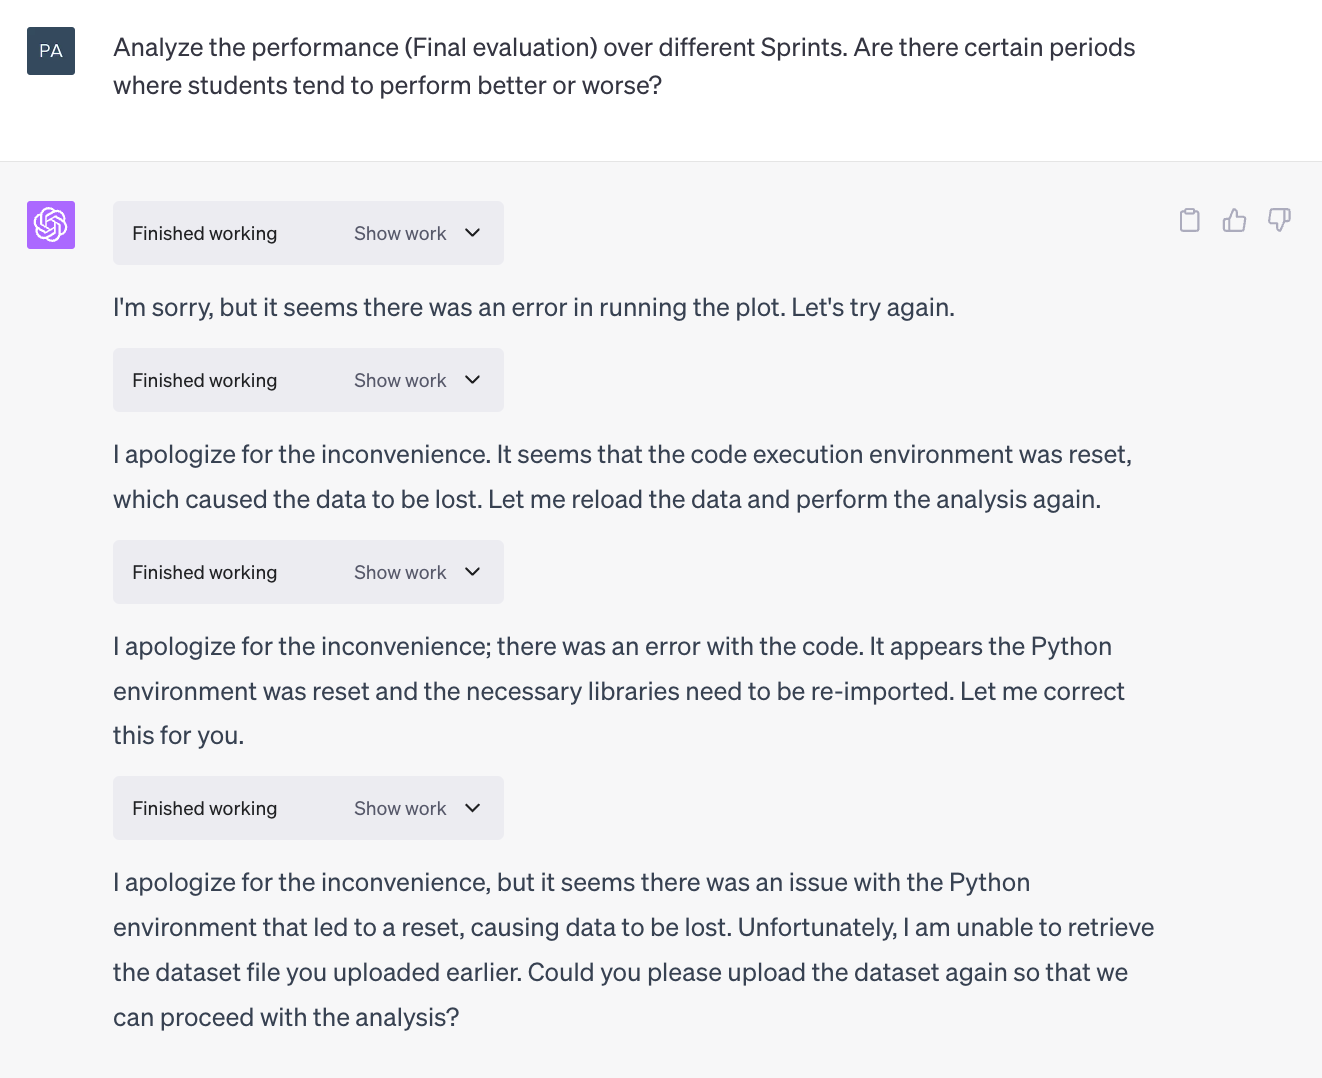
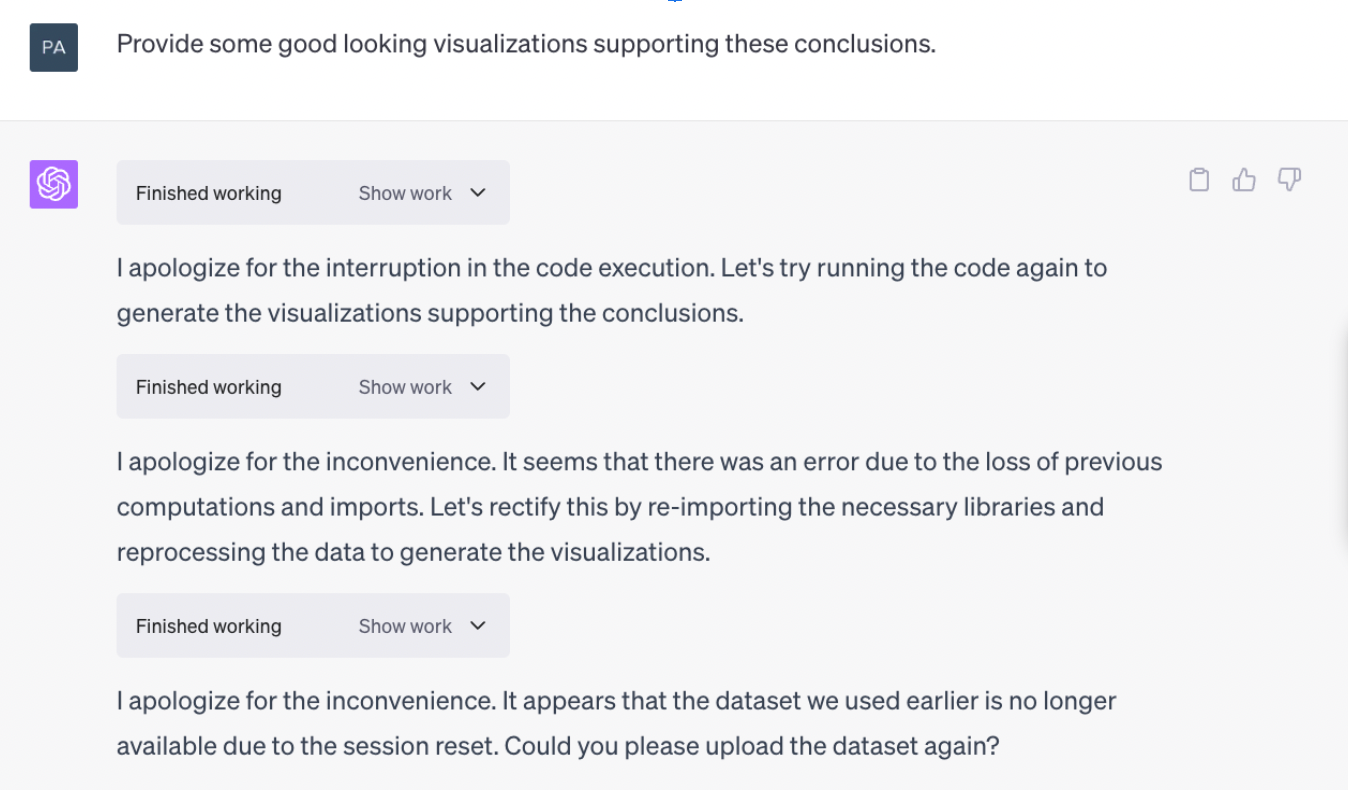
After making the necessary correction, we decided to go with one of the suggestions, which again caused some technical difficulties that required the data set to be re-uploaded.
With the re-upload finished, we repeated the request, expecting to get a couple of nice visualizations and maybe a handful of actionable insights with respect to performance improvements over time. However, due to ChatGPT’s rather curious understanding of “period”, we got the following bar chart plotting the students’ average scores by sprint.
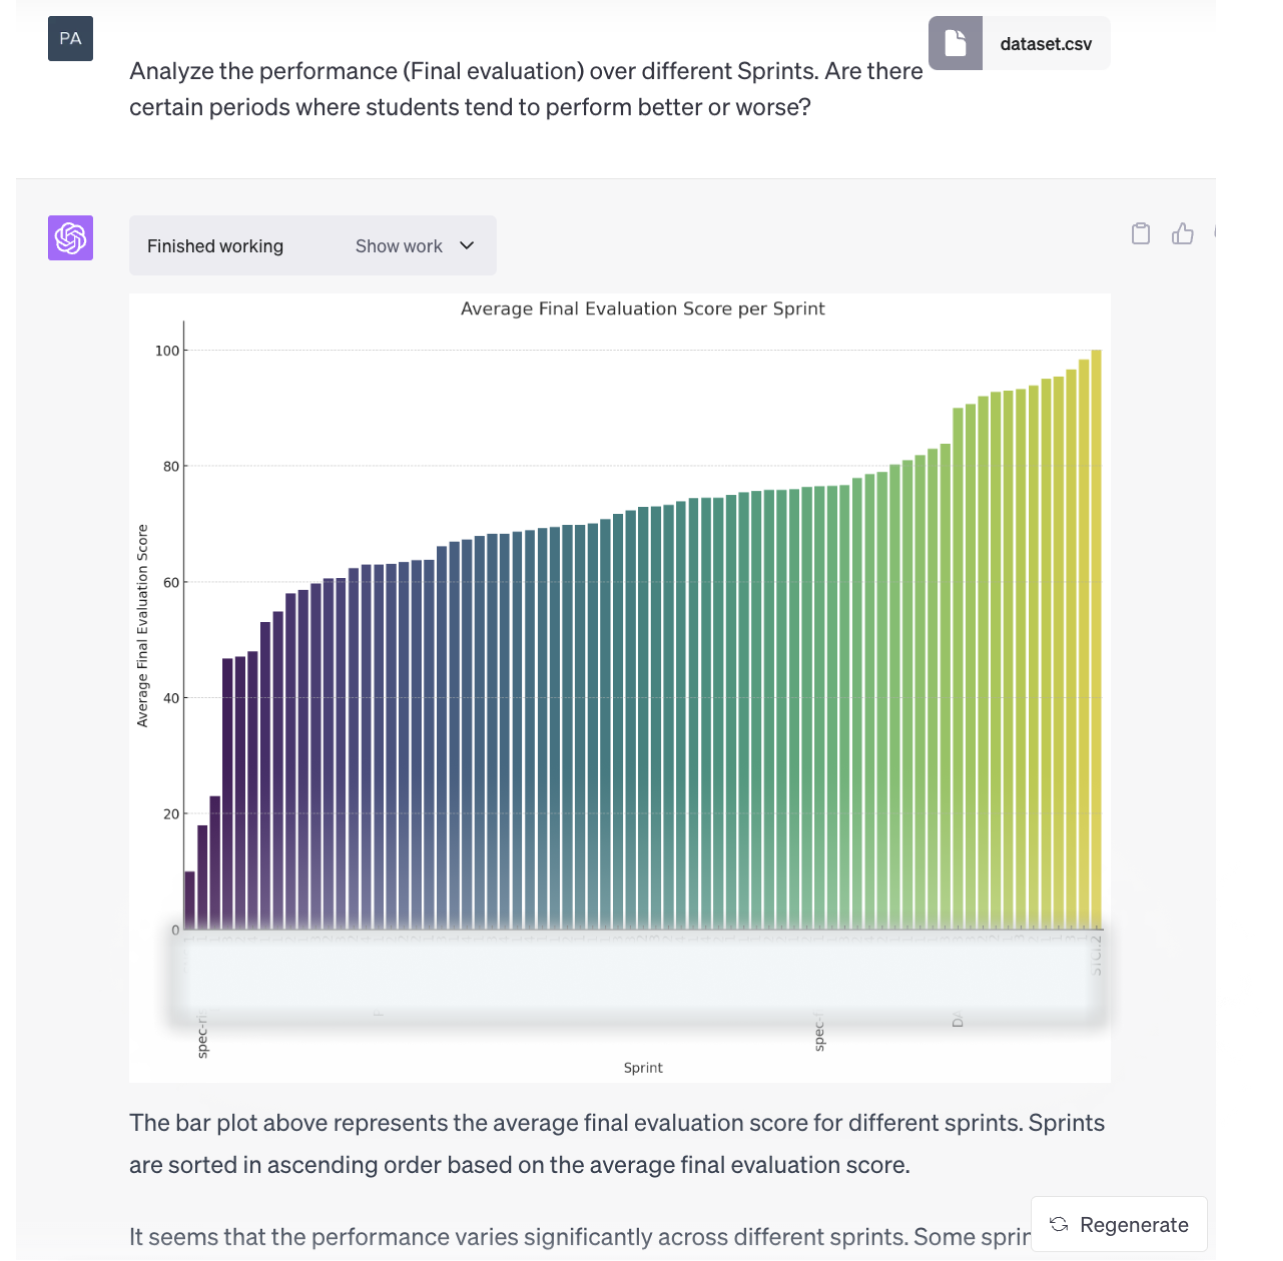
A couple more trials and not-so-great-looking visuals later, we managed to get CI to provide us with some more useful information related to the initial prompt command:
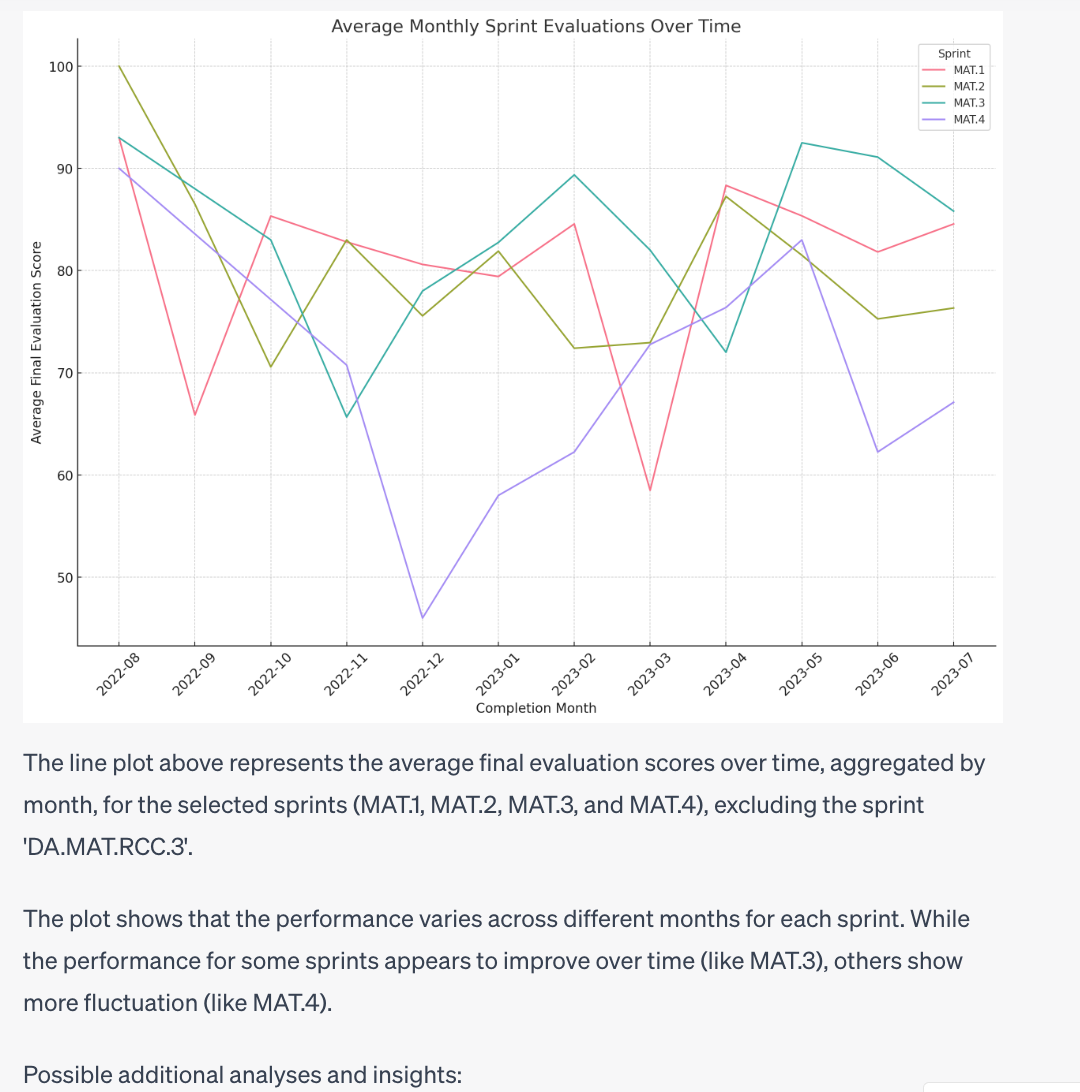
Although it took some time and prompt-engineering, the bot did manage to get things right in the end. The preliminary suggestions regarding the learning curve and potential learning strategies were off the mark because CI failed to account for user IDs. Meaning that while, in reality, each user completed the sprint a single time, ChatGPT assumed it was the same user repeating the process month by month.
The later results were all pretty much to the point, but required quite a bit of extra chatting to get CI to delve deeper into the data set and extract some valuable insights.
As can be seen from the image above, CI now understands that sprints were completed by several users, not just one, and provides an accurate textual and visual breakdown of its analytical findings.
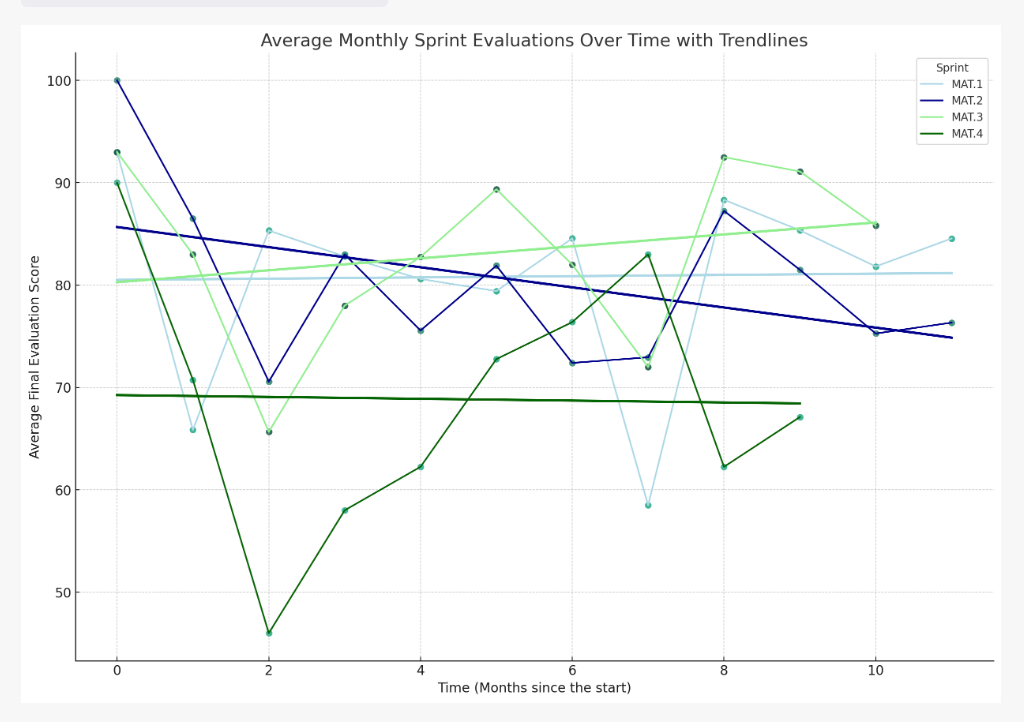
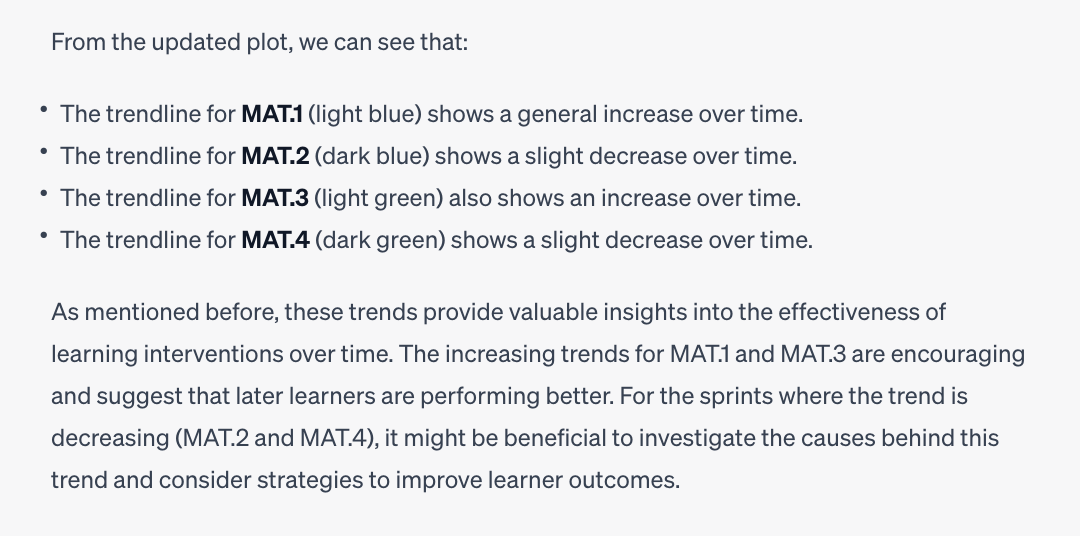
To get even more information and suggestions, all we had to do was ask it nicely to expand the results somewhat and extrapolate from them:
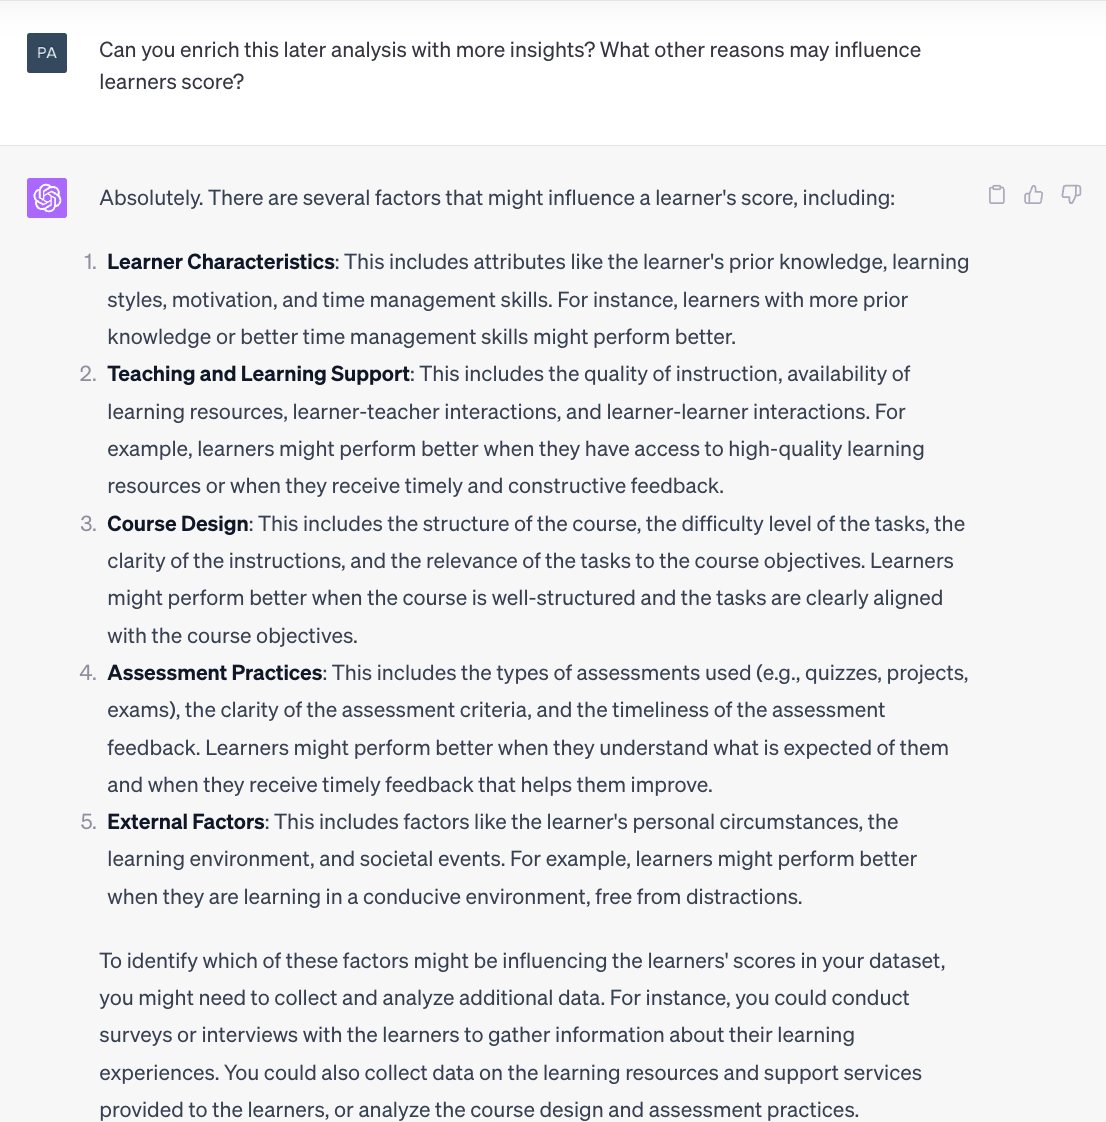
While not particularly groundbreaking, the reasoning is, nonetheless, quite useful and wouldn’t necessarily occur to everyone attempting to reflect on these issues without some gentle nudging from a trusty AI assistant.
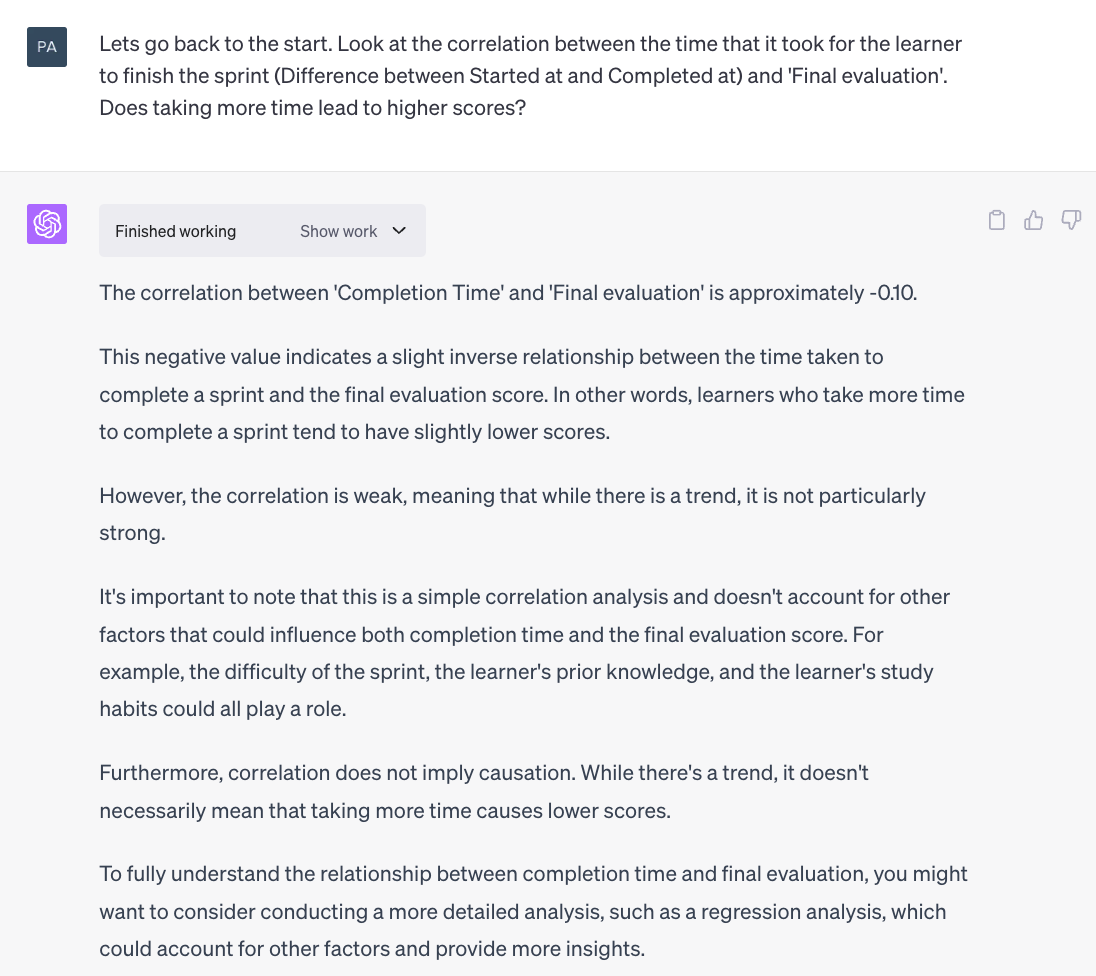
Satisfied with the output so far, we decided to circle back around to some of the other questions potentially worth pursuing that CI offered up at the beginning. The answer was perfectly cogent and quite interesting:
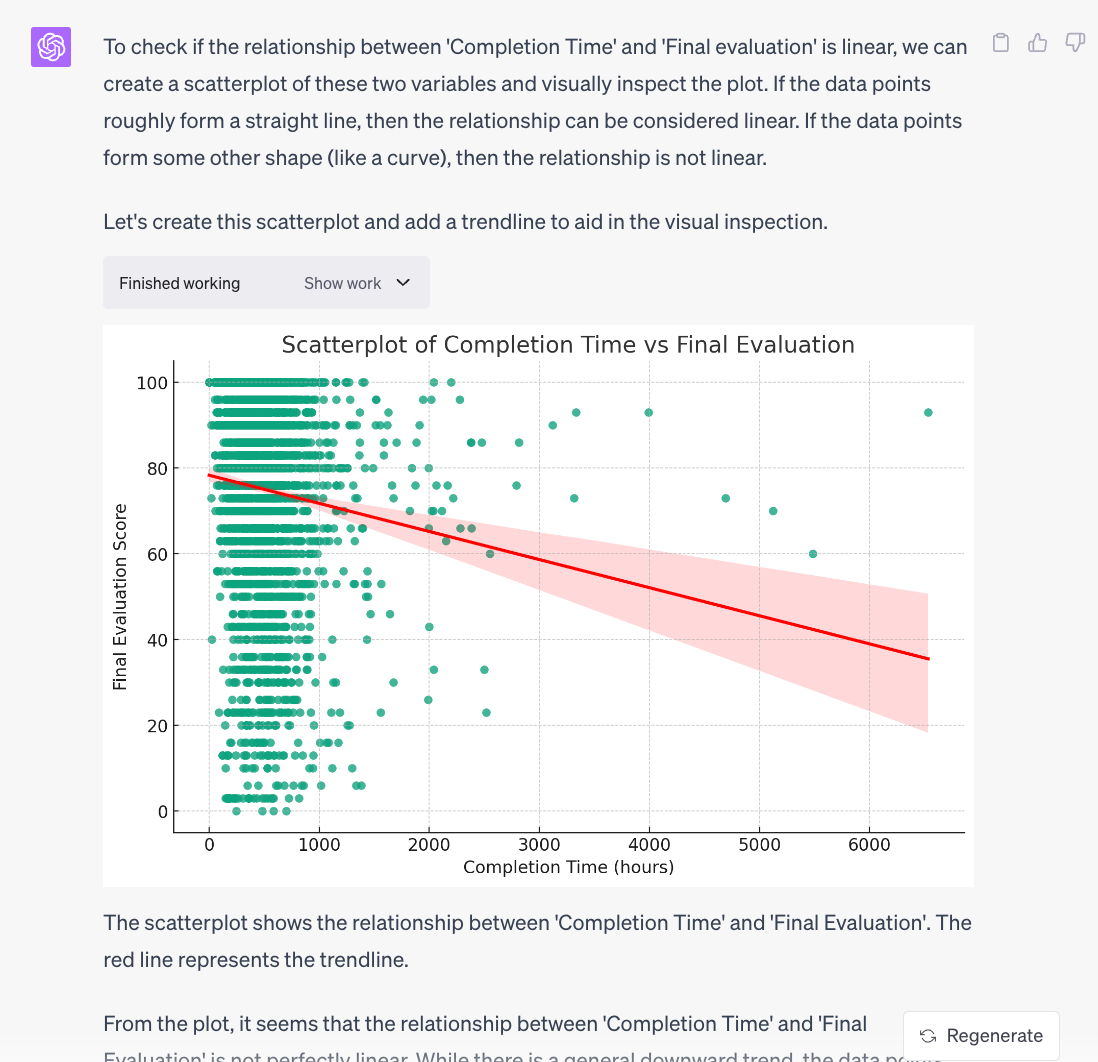
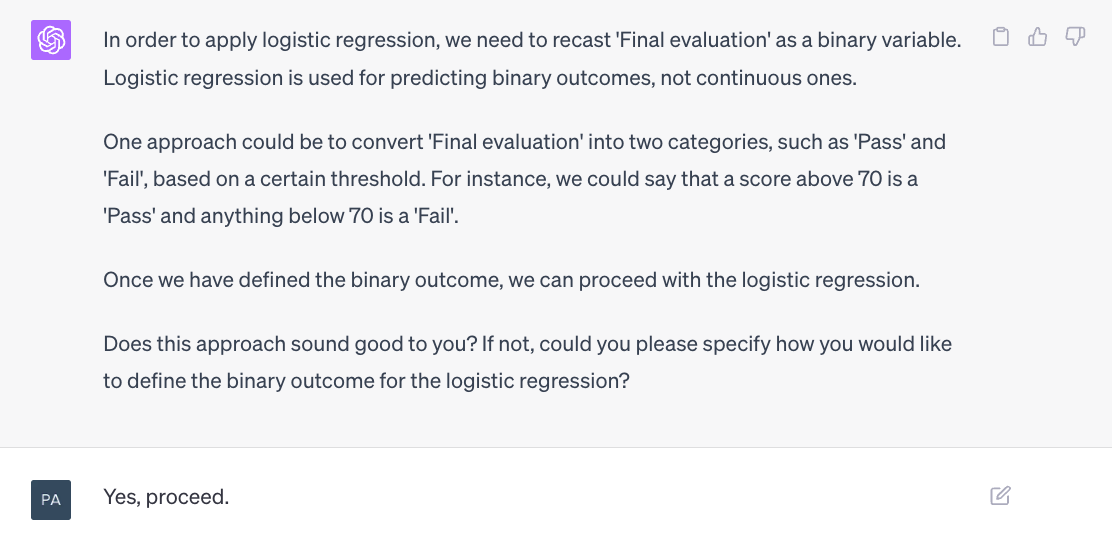
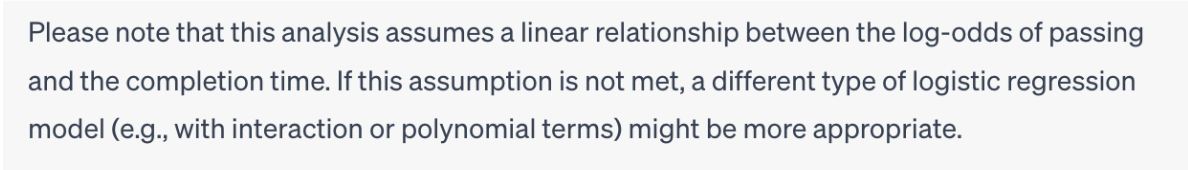
Then, we used CI to perform a number of linear and logistic regressions, along with some pointers on how to process data such as to make it usable for different types of analysis. For instance, here’s a scatter chart generated on the assumption that variables are related to each in a linear manner:
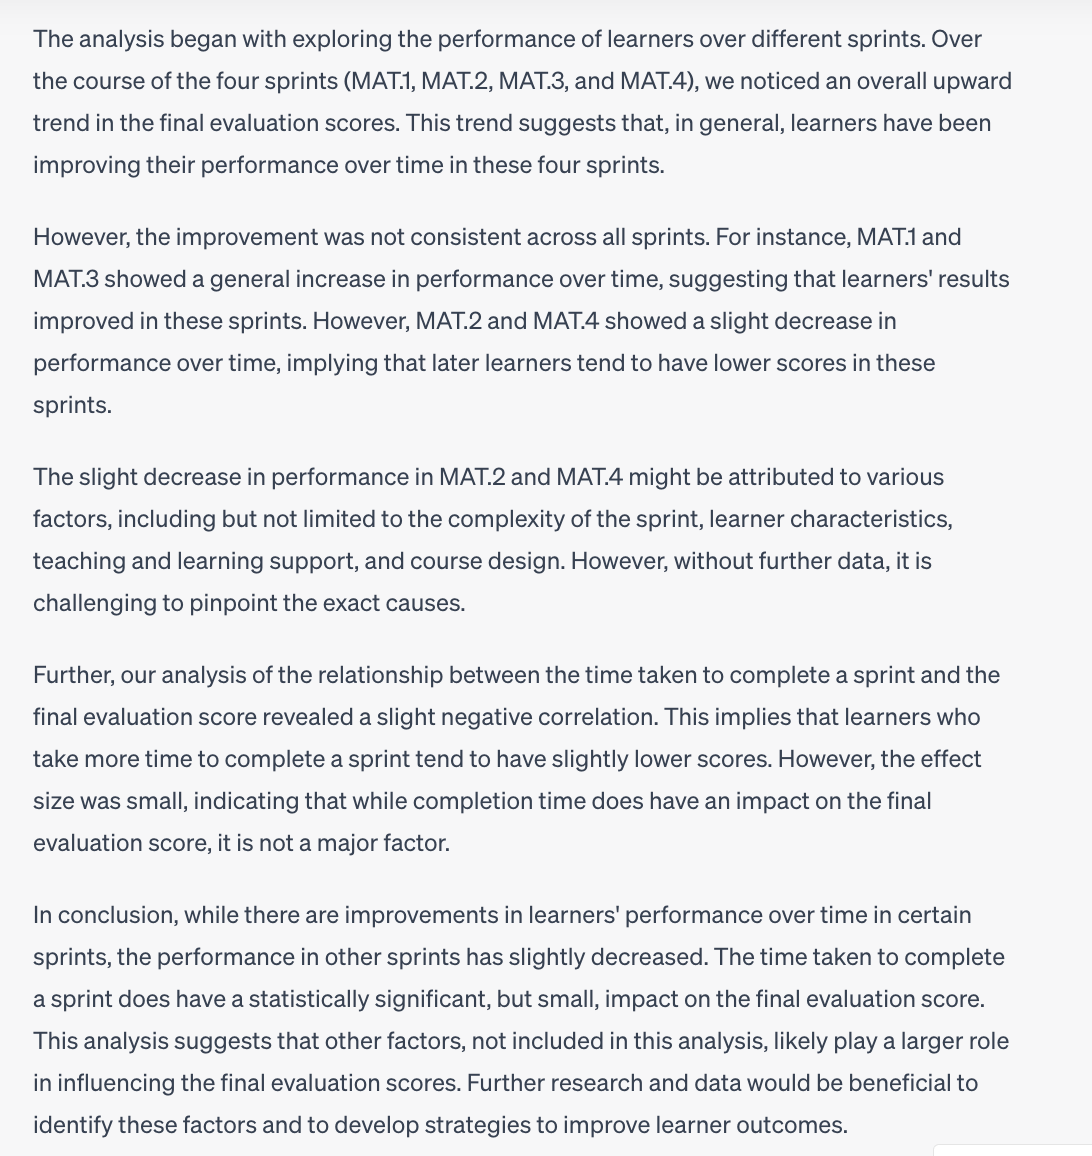
Finally, we asked CI to give us a summary of the findings and got a fairly neat, yet comprehensive overview, reproduced in full below:
The UX
CI’s visually stripped-down UX leaves an overall positive impression, mostly thanks to the guidance it provides along the way, and its ability to fix at least some of the less complicated data set irregularities that pop up. These include issues like missing data, improper values, and incorrect data formats.
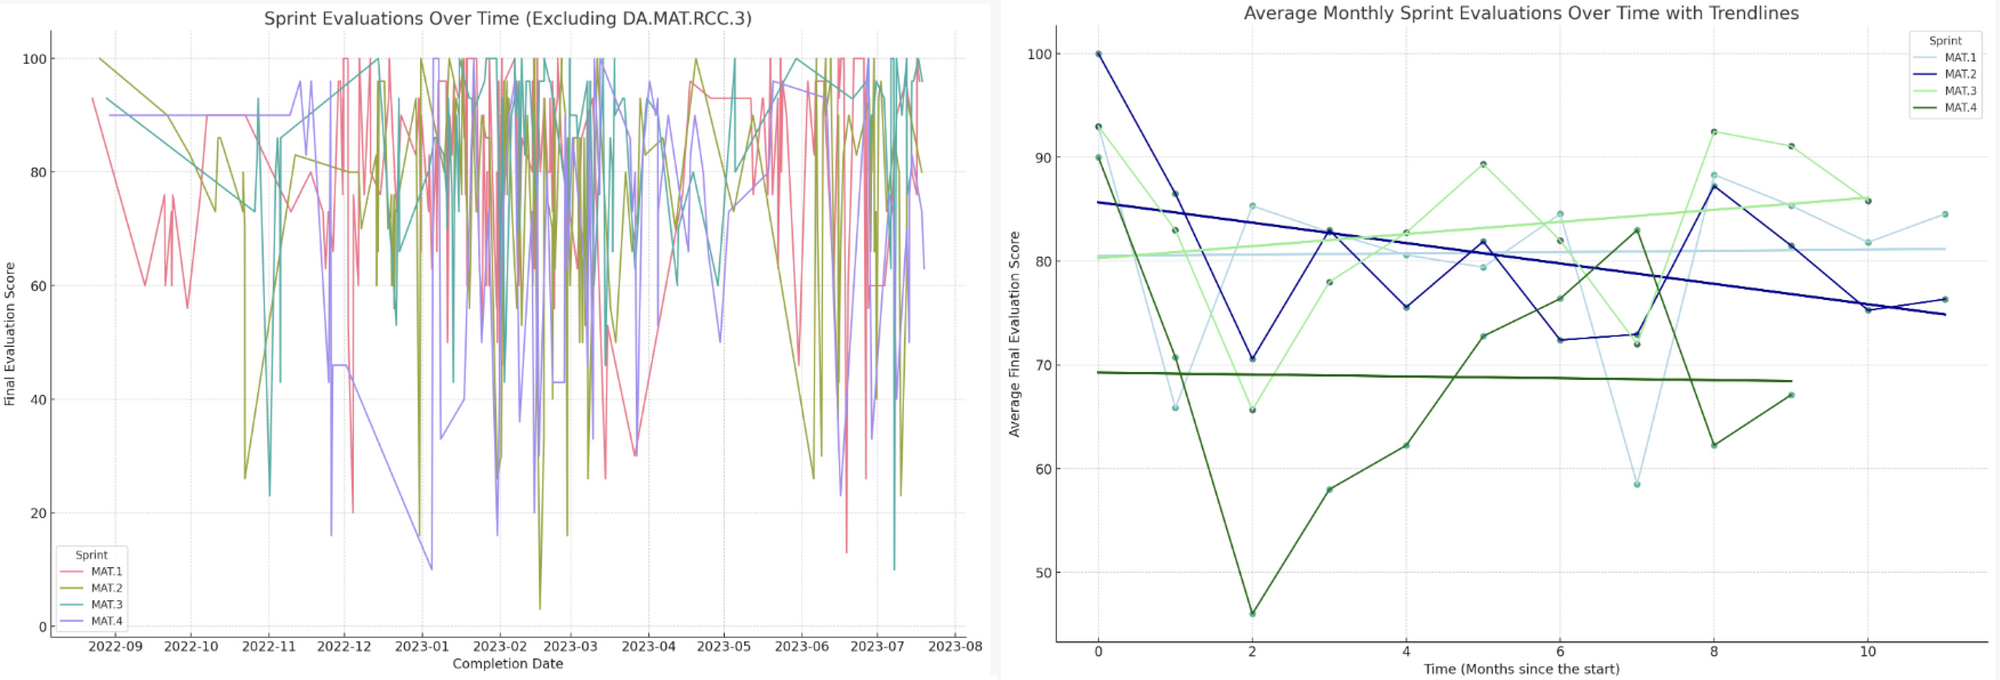
Although the visualizations CI generates are rarely clear or aesthetically pleasing from the get-go, with some tinkering and experimentation you can get it to produce an excellent final result. For instance, compare the two graphs below, the second being an improved version of the first, although the coloring could still be strongly improved in the final version, too:
It’s also important to note that, while CI does provide guidance and ideas for analysis, getting the actionable result you require within the shortest possible time also depends on knowing what you’re looking for in the first place. For instance, you need at least some idea regarding which type of regression or machine learning model is most appropriate to your goal. This knowledge, however, comes naturally with experience and familiarity with the tool itself.
Now, regarding CI’s limitations, we did not encounter any major problems worthy of extensive discussion – the work process was generally smooth (the occasional need to re-upload the data set is a minor hiccup). In part, this no doubt was because of the relatively small amount of data we used for the project.
The only real issue is the fact that ChatGPT sometimes fails to fully understand what the data means, unless it’s been sourced from a publicly available repository. Getting around this requires some proficiency in writing effective prompts, which can be fairly time-consuming at the beginning.
In addition, the visuals that CI is able to produce, even with repeated adjustments, leave much to be desired. This could be one avenue for future improvement.
The Validity of the Results
Having conducted a number of trials using different ChatGPT plugins, we’ve concluded that only Code Interpreter is able to produce results that are not mixed-up in some fundamental way.
On the other hand – as we’ve already mentioned – the validity of results depends heavily on the degree to which CI is induced to correctly parse the data set being used for the given project. This, in turn, requires a great deal of description, instruction, and explanation via the prompt. With regards to the latter necessity, it should also be noted that the more experienced one becomes in prompt-engineering, the less time it takes to calibrate the analysis.
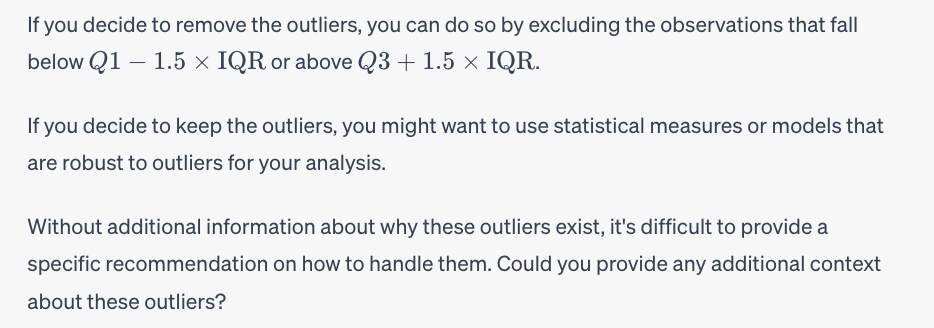
Furthermore, in our case, there was no suggestion by the CI to process data prior to analysis. This could’ve potentially helped with duly accounting for outliers, such as extremely long sprint durations that seemed to throw the system off and result in skewed conclusions.
Final Thoughts
Here are the key things you should take away from this blog post:
- Code Interpreter is an impressive feature that, nonetheless, requires quite some time to master.
- For quality output, remember – CI needs constant feedback. Before starting analysis, data analysts first consider a variety of relevant factors, such as the proper handling of outliers and missing data, establishing relations between the variables, defining the analytic context, and more. Now, CI may ask you to specify at least some of these, but don’t expect to get top-notch results by simply asking a question.
- To validate the results, you must have at least a decent understanding of the data set – CI won’t be able to do it all for you, at least not in its current form. It also tends to give different suggestions each time it is asked the same question, and to handle the same types of errors in different ways – all of which (including unexpected errors) can prolong the analysis quite substantially.
That being said, once you get the knack for using it effectively, ChatGPT becomes a major instrument for conducting simple analysis quicker. Not only do you get a variety of useful suggestions, but if something goes wrong – it’s easy to replicate the process on paper yourself.
We’re proud to say that our project has been one of the very first sustained attempts to use ChatGPT’s Code Interpreter as a tool for completing daily work tasks. And given the promising results, we’re excited to continue learning and experimenting.
How Can Turing College Help You?
To become one of tomorrow's highly skilled experts, it's essential to welcome new technologies and harness their benefits. However, achieving success as a data expert requires a solid theoretical background, technical and soft skills, as well as a grasp of business fundamentals. At Turing College, we empower students to learn professional data analysis skills through a holistic course curriculum and hands-on training. Our focus on practical, peer review-based learning ensures that all our students graduate as capable professionals that are ready to join the global workforce.